Ever driven through a state and wondered how some people managed to get their driver’s licenses?
Maybe someone cut across three lanes without signaling.
Or followed your bumper so closely that you could practically see their dashboard.
Every state has its share of frustrating drivers.
But a nationwide study suggests some states have far more recorded driving incidents than others.
And the results might surprise you.
According to LendingTree’s 2025 Best and Worst Drivers by State Report, North Dakota had the highest rate of driving incidents in the country.
New Jersey came in second.
Utah ranked third.
Meanwhile, Michigan had the lowest incident rate, followed by Florida and Colorado.
Yes, Florida — the state famous for busy highways, tourist traffic, and unpredictable driving moments — landed among the best.
So how did researchers reach these conclusions?
And where does your state rank?
Here’s what the numbers reveal.
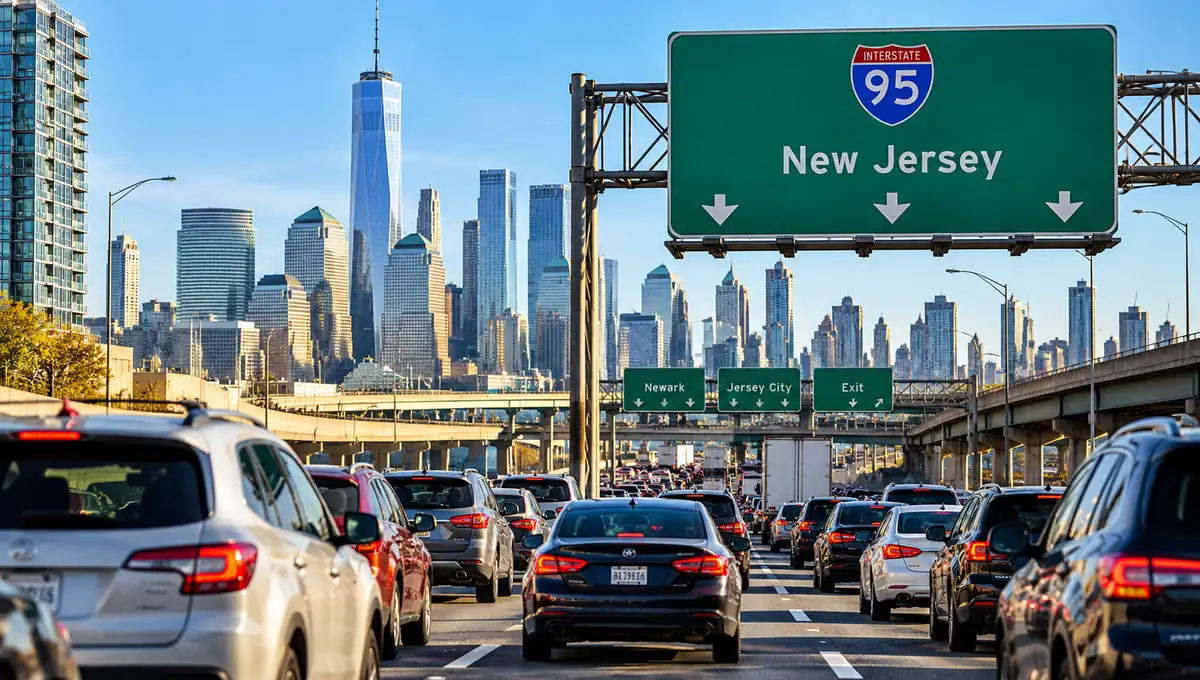
What State Has the Worst Drivers in America?
According to the LendingTree study, North Dakota ranked No. 1 for the worst drivers.
Researchers found 64.0 driving incidents per 1,000 drivers in the insurance inquiry data analyzed.
These incidents included accidents, DUI violations, speeding-related incidents, and other traffic citations.
North Dakota didn’t just perform poorly in one category.
It also recorded the highest DUI rate and speeding-related incident rate in the study.
That combination pushed it to the top of the worst-driver ranking.
New Jersey followed with 58.8 incidents per 1,000 drivers.
Utah came in third with 54.6.
But the most interesting part of the report is how differently the states performed across individual categories.
Also Read: Florida Declares State of Emergency in 25 Counties as Hurricane Isaias Threatens Gulf Coast
The 10 States With the Worst Drivers
Here are the states and the District of Columbia with the highest overall driving incident rates.
| Rank | State | Incidents per 1,000 drivers |
|---|---|---|
| 1 | North Dakota | 64.0 |
| 2 | New Jersey | 58.8 |
| 3 | Utah | 54.6 |
| 4 | Rhode Island | 52.2 |
| 5 | Washington | 44.9 |
| 6 | Maine | 44.1 |
| 7 | Idaho | 43.4 |
| 8 | District of Columbia | 42.2 |
| 9 | California | 41.9 |
| 10 | Montana | 40.3 |
Source: LendingTree, Best and Worst Drivers by State: 2025 Report.
The rankings are based on insurance inquiry data collected from January through September 2025.
Let’s look at the biggest surprises.
Why Did North Dakota Rank No. 1?
North Dakota isn’t usually the first place people think of when discussing stressful American driving.
It’s not home to the enormous traffic volumes of Los Angeles or New York City.
Yet its drivers recorded the highest overall incident rate in the LendingTree analysis.
The state had 64.0 incidents per 1,000 drivers.
It also recorded:
- 3.7 DUI incidents per 1,000 drivers, the highest rate in the study.
- 11.9 speeding-related incidents per 1,000 drivers, also the highest rate.
North Dakota was the only state with a speeding-related incident rate above 10 per 1,000 drivers.
That helps explain why it finished at the bottom of the overall ranking.
But remember, this is based on the drivers represented in LendingTree’s insurance inquiry data, not every driver living in North Dakota.
New Jersey Ranked No. 2 — And Had the Highest Accident Rate
New Jersey drivers might not love this result.
The Garden State ranked second-worst overall, with 58.8 incidents per 1,000 drivers.
But here’s the number that really stands out.
New Jersey had the highest accident rate in the entire study.
Researchers recorded 31.5 accidents per 1,000 drivers.
It was the only state to exceed 30 accidents per 1,000 drivers in the analyzed data.
Rhode Island followed with 29.0, while California recorded 28.1.
Interestingly, New Jersey had one of the lowest speeding-related incident rates.
That means its poor overall ranking wasn’t simply a matter of drivers getting caught speeding.
The accident numbers played a major role.
Utah Came in Third
Utah ranked third-worst, with 54.6 driving incidents per 1,000 drivers.
The state also had the second-highest speeding-related incident rate.
Researchers recorded 9.4 speeding-related incidents per 1,000 drivers.
Only North Dakota ranked higher.
Utah’s results show why it’s useful to look beyond the overall rankings.
Two states can finish near each other on the list for different reasons.
One might have a particularly high accident rate.
Another might struggle more with speeding or citations.
Rhode Island and Washington Rounded Out the Bottom Five
Rhode Island ranked fourth-worst overall.
Its rate of 52.2 driving incidents per 1,000 drivers was among the highest in the country.
The state also had the second-highest accident rate, at 29.0 per 1,000 drivers.
Washington finished fifth-worst, with 44.9 incidents per 1,000 drivers.
Those results may surprise readers who associate difficult driving mainly with America’s largest cities.
But the study measures incident rates among insurance inquiry records, not how stressful a highway feels during rush hour.
Which States Have the Best Drivers?
Now for the other side of the list.
According to LendingTree, Michigan had the lowest overall driving incident rate.
The state recorded just 20.9 incidents per 1,000 drivers.
Florida followed with 23.1.
Colorado ranked third-best at 23.7.
Here are the complete top 10.
The 10 States With the Best Drivers
| Rank | State | Incidents per 1,000 drivers |
|---|---|---|
| 1 | Michigan | 20.9 |
| 2 | Florida | 23.1 |
| 3 | Colorado | 23.7 |
| 4 | Connecticut | 24.1 |
| 5 | Illinois | 24.9 |
| 6 | Texas | 25.8 |
| 7 | West Virginia | 26.0 |
| 8 | Pennsylvania | 26.5 |
| 9 | Mississippi | 26.6 |
| 10 | Missouri | 26.9 |
Source: LendingTree, Best and Worst Drivers by State: 2025 Report.
A lower number means fewer recorded incidents per 1,000 drivers in the study.
And one of these results is especially interesting for Florida residents.
Florida Ranked No. 2 for the Best Drivers in America
If you’ve ever driven on Interstate 4 near Orlando or Interstate 95 through South Florida, this ranking might make you raise an eyebrow.
But according to LendingTree’s data, Florida finished second-best nationwide.
The state recorded 23.1 driving incidents per 1,000 drivers.
Only Michigan performed better.
Florida also had the third-lowest accident rate, at 11.9 per 1,000 drivers.
And the state recorded the lowest DUI incident rate in the study, at 0.4 per 1,000 drivers.
That’s a surprisingly strong showing.
Of course, the result doesn’t mean Florida roads are free of crashes, reckless driving, or dangerous conditions.
It means the drivers represented in this particular insurance dataset had relatively low recorded incident rates.
Different studies using police reports, traffic deaths, vehicle miles traveled, or insurance claims could produce different rankings.
Still, Florida’s result is likely to start plenty of conversations.
Michigan Had the Best Drivers Overall
Michigan took the top spot for the best drivers, with 20.9 incidents per 1,000 drivers.
It also had the lowest accident rate.
Researchers recorded 10.0 accidents per 1,000 drivers.
Colorado followed with 11.7 accidents per 1,000 drivers, while Florida had 11.9.
Those results helped Michigan lead the overall rankings.
But as with every state on this list, the numbers describe a particular dataset and time period.
They shouldn’t be treated as a guarantee about what any individual driver will experience.
Which State Had the Most Accidents?
The study found that New Jersey had the highest accident rate.
Here were the three highest:
| Rank | State | Accidents per 1,000 drivers |
|---|---|---|
| 1 | New Jersey | 31.5 |
| 2 | Rhode Island | 29.0 |
| 3 | California | 28.1 |
The three lowest accident rates were:
| Rank | State | Accidents per 1,000 drivers |
|---|---|---|
| 1 | Michigan | 10.0 |
| 2 | Colorado | 11.7 |
| 3 | Florida | 11.9 |
This is one reason New Jersey’s overall ranking deserves attention.
Although North Dakota had more total driving incidents, New Jersey led the accident category.
Which State Had the Most DUI Incidents?
North Dakota also topped the DUI category.
Its rate was 3.7 DUI incidents per 1,000 drivers.
California followed with 3.5, while Minnesota recorded 2.8.
At the other end of the list, Florida had the lowest DUI rate in the study, at 0.4.
Illinois, Mississippi, and West Virginia each recorded 0.6.
These figures reflect the DUI incidents appearing in the analyzed insurance inquiry records.
They are not a complete count of every impaired-driving incident or arrest in those states.
Which State Had the Most Speeding Incidents?
North Dakota led this category too.
It recorded 11.9 speeding-related incidents per 1,000 drivers.
Utah came second with 9.4.
Vermont ranked third with 7.7.
Surprisingly, New Jersey had the lowest speeding-related incident rate at just 0.2 per 1,000 drivers.
Massachusetts followed with 0.3, while New York recorded 0.4.
So even though New Jersey ranked second-worst overall, it performed much better in the speeding category.
That’s why the full report is more interesting than a simple list of winners and losers.
How Did LendingTree Rank the States?
LendingTree analyzed tens of millions of auto insurance inquiries submitted through QuoteWizard by LendingTree.
The study covered January 1 through September 30, 2025.
Researchers examined four types of incidents:
- Accidents
- Driving under the influence
- Speeding-related incidents
- Other traffic citations
They then calculated the overall number of driving incidents per 1,000 drivers represented in the data for each state.
The analysis also included Washington, D.C., which is why the full ranking has 51 entries.
One important limitation is that people requesting insurance quotes may not perfectly represent every licensed driver in a state.
Also, the data isn’t the same as measuring fatal crashes, total crashes on public roads, or miles driven.
So the report is best understood as a comparison of recorded driving incidents within LendingTree’s insurance inquiry dataset.
Does This Mean Florida Roads Are Safer Than New Jersey Roads?
Not necessarily.
The study ranked Florida better than New Jersey based on its selected measures.
But that doesn’t automatically mean every Florida road is safer.
Road safety depends on many factors, including traffic volume, road design, weather, driving behavior, and the number of miles people travel.
A state can have a low incident rate in insurance inquiry data while still experiencing serious traffic safety problems.
That’s why it’s useful to consider multiple measures when comparing states.
LendingTree’s report offers one perspective on driver behavior, not a final verdict on every state’s roads.
Full Rankings: Where Does Your State Stand?
For readers who want to compare more than the top 10, here’s the complete ranking from the highest incident rate to the lowest.
| Worst-driver rank | State | Incidents per 1,000 |
|---|---|---|
| 1 | North Dakota | 64.0 |
| 2 | New Jersey | 58.8 |
| 3 | Utah | 54.6 |
| 4 | Rhode Island | 52.2 |
| 5 | Washington | 44.9 |
| 6 | Maine | 44.1 |
| 7 | Idaho | 43.4 |
| 8 | District of Columbia | 42.2 |
| 9 | California | 41.9 |
| 10 | Montana | 40.3 |
| 11 | North Carolina | 39.9 |
| 12 | Wyoming | 39.6 |
| 13 | Virginia | 39.4 |
| 14 | Vermont | 39.2 |
| 15 | Kansas | 38.7 |
| 16 | Oregon | 38.6 |
| 17 | Wisconsin | 38.0 |
| 18 | Maryland | 37.4 |
| 18 | Massachusetts | 37.4 |
| 20 | South Dakota | 36.9 |
| 21 | Nebraska | 36.1 |
| 21 | New Hampshire | 36.1 |
| 23 | Ohio | 36.0 |
| 24 | South Carolina | 35.9 |
| 25 | Iowa | 35.8 |
| 26 | Alaska | 35.5 |
| 27 | Nevada | 33.8 |
| 28 | Tennessee | 33.7 |
| 29 | Indiana | 33.2 |
| 30 | Louisiana | 32.9 |
| 31 | Delaware | 31.9 |
| 32 | Minnesota | 31.8 |
| 33 | New Mexico | 31.1 |
| 34 | Alabama | 30.7 |
| 34 | New York | 30.7 |
| 36 | Georgia | 30.6 |
| 37 | Oklahoma | 29.9 |
| 38 | Hawaii | 29.4 |
| 39 | Arkansas | 29.3 |
| 40 | Kentucky | 28.0 |
| 41 | Arizona | 27.8 |
| 42 | Missouri | 26.9 |
| 43 | Mississippi | 26.6 |
| 44 | Pennsylvania | 26.5 |
| 45 | West Virginia | 26.0 |
| 46 | Texas | 25.8 |
| 47 | Illinois | 24.9 |
| 48 | Connecticut | 24.1 |
| 49 | Colorado | 23.7 |
| 50 | Florida | 23.1 |
| 51 | Michigan | 20.9 |
Source: LendingTree’s 2025 report. Tied positions share the same rank.
The Bottom Line
No matter where you live, you’ve probably encountered a driver who made you wonder what they were thinking.
But this study offers a more measurable way to compare driving incidents across the country.
North Dakota had the highest overall incident rate.
New Jersey ranked second-worst and led the accident category.
Utah came in third-worst.
Meanwhile, Michigan, Florida, and Colorado recorded the lowest overall incident rates.
The rankings don’t tell us everything about road safety, but they do reveal some unexpected differences between states.
And they raise one question that’s almost guaranteed to start a debate:
Does your state’s ranking match what you’ve experienced on the road?
Original study: https://www.lendingtree.com/insurance/best-worst-drivers-study/
Florida Declares State of Emergency in 25 Counties as Hurricane Isaias Threatens Gulf Coast

7 Florida Law Changes Starting This Week — Here’s What Residents Should Know

North Miami Beach Turns 100 — And It’s Throwing a Huge Free Festival This Saturday
